





.png)








Besides single questions, you can also have your AI assistant create real analyses: a cash flow forecast, a margin overview or an ageing analysis. To do this, the assistant combines data from your entire administration into useful insight, without you having to set up or export reports yourself.

.png?width=46&height=46&name=vecteezy_artificial-intelligence-ai-processor-chip-vector-icon-symbol_6662139%20(1).png)
From a single question to real analysis
An ordinary question gives you an answer from your records. An analysis goes a step further: the assistant combines several pieces of data, such as outstanding items, due dates, revenue and purchase value, into an overview with a conclusion. You ask for it in plain language and get the insight back, without setting up a report yourself, placing columns side by side or exporting.
These deeper analyses use the Analytics subscription, which is built to calculate across larger amounts of data. You run them on demand: you request the analysis when you need it. Below is what each analysis does, which data goes into it and what you get back.
The analyses at a glance
Cash flow forecast
Projects how much money will come in and go out over the coming months, so you can plan ahead: is there room for a large purchase, or is a tight month coming up?
Accounts receivable ageing analysis
Shows how long your invoices have been outstanding and which customers are building up payment risk. An ideal basis for following up on your receivables, because you know right away who to approach first.
Gross margin per product group
Shows your margin per product group and reveals where it drops the fastest, as a basis for pricing and purchasing decisions.
Costs year-on-year
Compares your costs with the same period last year and points out the largest deviations, so you can quickly see which items are out of line.
Smart payments
Determines which invoices you can pay later without missing a due date, so you keep money in your account longer.
Working capital in key figures
Calculates your DSO (how quickly you get paid on average), your DPO (how quickly you pay yourself) and your working capital requirement, and compares it with the previous quarter.
This is what an answer looks like
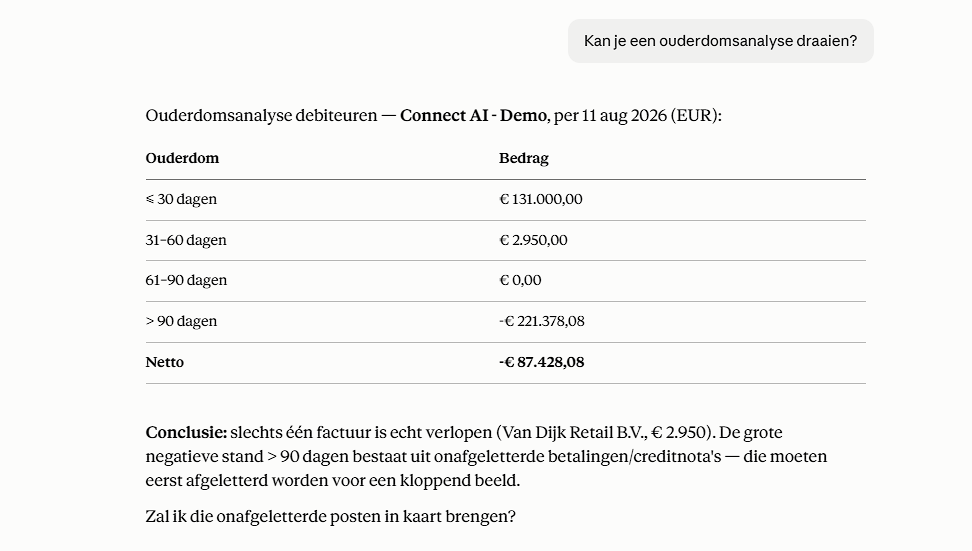
Here is a worked-out aging analysis as an illustration. You get the other analyses back in the same clear format: first the figures, then a short conclusion.
Asking follow-up questions about your analysis
An analysis is not an endpoint. You can immediately ask follow-up questions without running the analysis again. For example:
This way you move from an analysis to a concrete next step. If that becomes a writing action, such as drafting a reminder, it first comes ready as a draft that you approve. Want to view an analysis more often without requesting it again? Then you turn it into a dashboard.
Connect your Exact Online administration to your AI assistant and ask your first question within a few minutes. You stay in control of every action yourself.
View Exact AI Connect